Plasma Crash Course - coredumpd
A while ago a colleague of mine asked about our crash infrastructure in Plasma and whether I could give some overview on it. This seems very useful to others as well, I thought. Here I am, telling you all about it!
Our crash infrastructure is comprised of a number of different components.
- KCrash: a KDE Framework performing crash interception and prepartion for handover to…
- coredumpd: a systemd component performing process core collection and handover to…
- DrKonqi: a GUI for crashes sending data to…
- Sentry: a web service and UI for tracing and presenting crashes for developers
We’ve looked at KCrash previously. This time we look at coredumpd.
Coredumpd
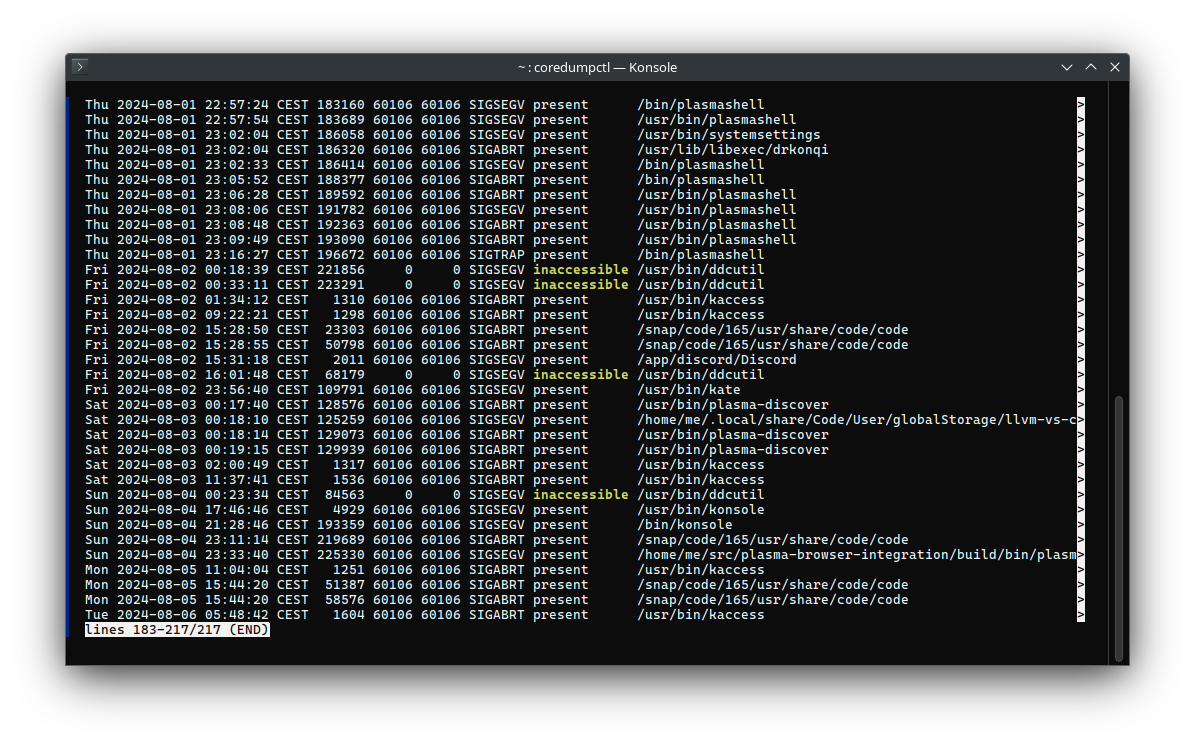
coredumpd collects all crashes happening on the system, through the core_pattern system. It is shipped as part of systemd and as such mostly available out of the box.
It is fairly sophisticated and can manage the backlog of crashes, so old crashes get cleaned out from time
to time. It also tightly integrates with journald giving us a well-defined interface to access crash
metadata.

But before we dive into the inner workings of coredumpd, let’s talk about cores.
What are cores?
A core, or more precisely: a core dump file, is a copy of the memory image of a process and its process status (registers, mappings, etc.) in a file. Simply put, it’s like we took a copy of the running process from RAM and stored it in a file. The purpose of such a core is that it allows us to look at a snapshot of the process at that point in time without having the process still running. Using this data, we can perform analysis of the process to figure out what exactly went wrong and how we ended up in that situation.
The advantage is that since the process doesn’t need to be running anymore, we can investigate crashes even hours or days after they happened. That is of particular use when things crash while we are not able to deal with them immediately. For example if Plasma were to crash on logout there’d be no way to deal with it besides stopping the logout, which may not even be possible anymore. Instead we let the crash drop into coredumpd, let it collect a core file, and on next login we can tell the user about the crash.
With that out of the way, it’s time to dump a core!
Core Dumps
We already talked about KCrash and how it intercepts crashes to write some metadata to disk. Once
it is done it calls raise() to generate one of those core dumps we just discussed. This
actually very briefly turns over control to the kernel which will more or less simply invoke the defined core_pattern process. In our case, coredumpd.
coredumpd will immediately systemd-socket-activate itself and forward the data received from the kernel. In other words: it will start an instance of systemd-coredump@.service and the actual processing will happen in there. The advantage of this is
that regular systemd security configuration can be applied as well as cgroup resource control and all that jazz — the core dumping happens in a regular systemd service.
The primary task here is to actually write the dump to a file. In addition, coredumpd will also
collect lots of additional metadata besides what is in the core already. Most notably various bits
and pieces of /proc information such as cgroup information, mount information, the auxillary vector (auxv), etc.
Once all the data is collected a journald entry is written and the systemd-coredump@.service instance quits again.
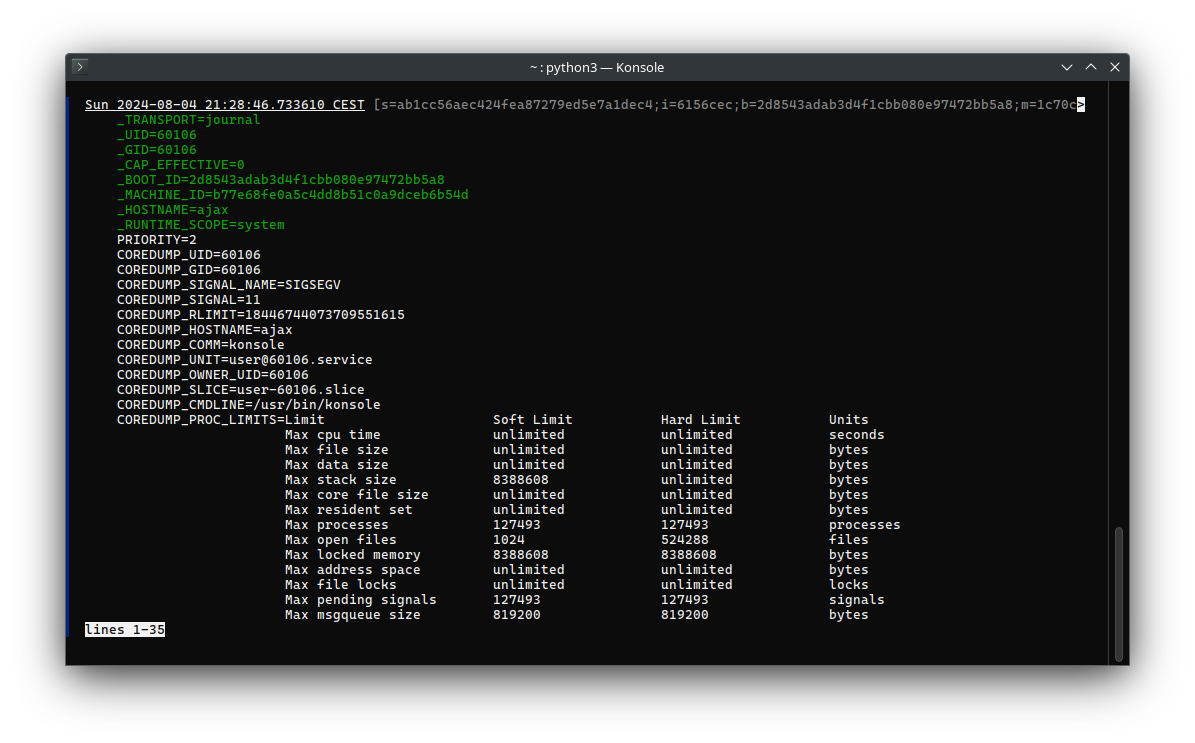
The journal entry will contain the metadata as entry fields as well as the path of the core dump on disk, so we can later access it. It essentially serves as a key-value store for the crash data. A severely shortened version looks like this:
Tue 2024-08-27 17:52:27.593233 CEST […]
    COREDUMP_UID=60106
    COREDUMP_GID=60106
    COREDUMP_SIGNAL_NAME=SIGSYS
    COREDUMP_SIGNAL=31
    COREDUMP_TIMESTAMP=1724773947000000
    COREDUMP_COMM=wine64
    COREDUMP_FILENAME=/var/lib/systemd/coredump/core.wine64.….zst
    …
Example
Since this is all rather abstract, we can look at a trivial example to illustrate things a bit better.
Let’s open two terminals. In the first we can watch the journal for the crash to appear.
journalctl -xef SYSLOG_IDENTIFIER=systemd-coredump
In the second terminal we run an instance of sleep in the background, and then trigger a segmentation fault crash.
sleep 99999999999&
kill -SEGV $!
In the first terminal you’ll see the crash happening:
Aug 27 15:01:49 ajax systemd-coredump[35535]: Process 35533 (sleep) of user 60106 terminated abnormally with signal 11/SEGV, processing...
Aug 27 15:01:49 ajax systemd-coredump[35549]: [🡕] Process 35533 (sleep) of user 60106 dumped core.

                                              Stack trace of thread 35533:
                                              #0  0x0000729f1b961dc0 n/a (/lib/ld-linux-x86-64.so.2 + 0x1cdc0)
                                              ELF object binary architecture: AMD x86-64
So far so interesting. “But where is the additional data from /proc hiding?” you might wonder. We need to look at the verbose entry to see all data.
journalctl -o verbose SYSLOG_IDENTIFIER=systemd-coredump

This actually already concludes coredumpd’s work. In the next post DrKonqi will step onto the stage.